Recent Posts
Why are they like dis
World's Opinion on Gypsies
Paki controversy pata chli
Avg latrine
Wanna leave vishwagandu asap ....
yaar Heendu tera world class gurukul kahaan hai ?
Every modi and epstein files
The Islamic-Aryan spirit hindu dasyus fear
Question to dalits and muslims
now I think he was right about him
REJERBHATION LE BAD
New ALT RIGHT
Caste kangers idhar aana tumhara sariya karu
Monotheists won long ago
Hardeep puri email to Epstein
Bladdy
Real Hindu General /RHG/
SAVARNA BLACKPILL
Loox is law
We are still being ruled ...
Gems of Constitution
Where are the fucking core jobs?

oaiLGt
No.6304
I can't take it anymore. I can't spend another fucking month jobless and doing the exact same things that I have been doing since I quit 4 months ago.
Since the Indian government refuses to comment anything about unemployment, underemployment, job creation, job creation and anything related to jobs, I'm going to take matter into my own hands and try to "investigate" whether I am actually hunting for a unicorn or if my desire of wanting a core job (because that's what my CV is going to mostly fit into right now at this sorry state of my life).
At this point I just want a closure instead of being stuck and doing the same things again and again. I am tired of applying for these low quality piece of shit garbage ass 2.5 LPA this job involves travel within cities rotating shift (by the way I am a nigger) ass jobs that get posted in Naukri and still not getting selected for it.

oaiLGt
No.6305
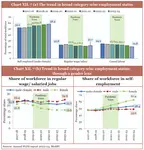
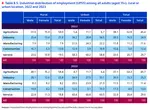
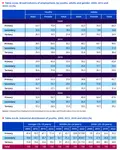
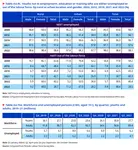
>The proportion of self-employed workers in the workforce has risen from 52.2 per cent in 2017-18 to 58.4 per cent in 2023-24. This shift reflects growing entrepreneurial activity and a preference for flexible work arrangements. **While the share of workers
(male and female) in regular/salaried jobs decreased from 22.8 per cent to 21.7 per cent during the same period, the trend has stabilised since 2020-21, with employment levels either holding steady or showing gradual improvement.** The decline in casual workers, from 24.9 per cent to 19.8 per cent, also indicates a shift toward more structured forms of self-employment. These changes suggest an evolving workforce that embraces flexibility and independence in response to industry transformations and individual preferences.

oaiLGt
No.6306
Shit.
>>6305
The proportion of self-employed workers in the workforce has risen from 52.2 per cent in 2017-18 to 58.4 per cent in 2023-24. This shift reflects growing entrepreneurial activity and a preference for flexible work arrangements. While the share of workers (male and female) in regular/salaried jobs decreased from 22.8 per cent to 21.7 per cent during the same period, the trend has stabilised since 2020-21, with employment levels either holding steady or showing gradual improvement. The decline in casual workers, from 24.9 per cent to 19.8 per cent, also indicates a shift toward more structured forms of self-employment. These changes suggest an evolving workforce that embraces flexibility and independence in response to industry transformations and individual preferences.

oaiLGt
No.6307
>>6306
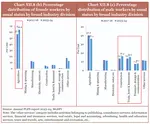
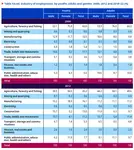
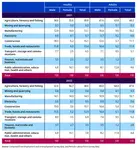
According to the PLFS 2023-24, the agriculture sector remains dominant in employment, with its share rising from 44.1 per cent in 2017-18 to 46.1 per cent in 2023-24. The share of industry and services sectors saw declines in employment share, with manufacturing falling from 12.1 per cent to 11.4 per cent, and services from 31.1 per cent to 29.7 per cent during the same period. The share of female workers in agriculture has increased significantly, from 57.0 per cent in 2017-18 to 64.4 per cent in 2023-24, whereas, male participation in agriculture decreased from 40.2 per cent to 36.3 per cent. Greater male involvement in sectors like construction, trade, hotel, restaurant, transport, storage and communication services is observed.

oaiLGt
No.6308
>>6307
In urban areas, women predominantly work in other services, though this share declined slightly from 44.4 per cent in 2017-18 to 40.1 per cent in 2023-24. Significant employment of females is also observed in manufacturing, trade, and agriculture. Male workers in urban areas are seen to be primarily employed in manufacturing, construction, and trade-related services.

MTNV8a
No.6309
apni maa se puch

oaiLGt
No.6310
>>6309
Poda

oaiLGt
No.6311
Corporate profitability soared to a 15-year peak in FY24, fuelled by robust growth in financials, energy, and automobiles. Among Nifty 500 companies, the profit-to-GDP ratio surged from 2.1 per cent in FY03 to 4.8 per cent in FY24, the highest since FY08. Large corporations, especially in non-financial sectors, significantly outperformed their smaller
peers in profitability.
However, while profits surged, wages lagged. A striking disparity has emerged in corporate India: profits climbed 22.3 per cent in FY24, but employment grew by a mere 1.5 per cent. 60 State Bank of India (SBI) analysis reveals that 4,000 listed companies recorded a modest 6 per cent revenue growth. At the same time, employee expenses rose only 13 per cent down from 17 per cent in FY23 - highlighting a sharp focus on cost-cutting over workforce expansion.
Despite Indian companies achieving a stable EBITDA margin of 22 per cent over the last four years, wage growth has moderated. This uneven growth trajectory raises critical concerns. Wage stagnation is pronounced, particularly at entry-level IT positions.
While the labour share of GVA shows a slight uptick, the disproportionate rise in corporate profits—predominantly among large firms—raises concerns about income inequality. A higher profit share and stagnant wage growth risk slowing the economy by curbing demand. Sustained economic growth hinges on bolstering employment incomes, which directly fuel consumer spending, spurring investment in production capacity.
To secure long-term stability, a fair and reasonable distribution of income between capital and labour is imperative. It is essential for sustaining demand and supporting corporate revenue and profitability growth in the medium to long run. Japan succeeded in industrialisation and in becoming a developed economy, despite its defeat in WW II through a social contract between the government, the businesses and workers, write Matthew C. Klein and Michael Pettis in “Trade Wars are Class Wars”:
“Japanese workers, consumers, and retirees all subsidised industrial development by overpaying for goods and services, by taking home a lower share of national output than their counterparts in the West, and by using a financial system designed to transfer purchasing power from households to businesses. Japanese companies returned the
favour by upgrading the country’s manufacturing base, passing along productivity gains to workers, and refraining from excessive executive pay, while the government invested in top-tier infrastructure.”
Not going to ever happen in India. Corrupt babus are only concerned about their self-interests.

oaiLGt
No.6312
Seven industry groups in the sector contribute to around 54 per cent of the total employment. These are food products, textiles, basic metals, wearing apparel, motor vehicles, trailers and semi-trailers, machinery and equipment N.E.C., and chemicals and chemical products. Other than these leading industries, industry groups representing computer, electronic and optical products and the manufacture of furniture have seen strong growth in employment compared to the pre-pandemic level with around 50 per cent growth in TPE. This indicates a positive shift towards electronics manufacturing in India.

oaiLGt
No.6313
Absolutely br00tal.
>>6312
Across age groups, the age group of 18-25 years contributed to 47 per cent of the net payroll addition in April-November 2024. With nearly 61 per cent of net payroll addition coming from less than 29 years of age (in the same period), new jobs in the organised sector are mainly going to the youth.
It's over for us unkils.

oaiLGt
No.6314
>>6313
According to the 2024 Annual Review by the International Renewable Energy Agency (IRENA), the total number of jobs in the renewable energy sector in India reached an estimated 1.02 million in 2023. Hydropower is the largest employer in India’s renewable sector, providing approximately 453,000 jobs and accounting for 20 per cent of the global total, ranking second only to China.
I wish I could work in a dam.

oaiLGt
No.6315
LMFAO this one is damn good.
>>6314
A detailed examination of the annual PLFS 2023-24 unit-level data has been conducted to understand India's skill and job landscape here. The PLFS data shows that 90.2 per cent of the workforce has equivalent to or less than a secondary level of education. This educational skill composition, as a result, leads to most of the workforce (88.2 per cent) being involved in low-competency occupations- elementary skilled and semi-skilled occupational skills.
What is this pig ass (by the way I am a nigger) shit?
That means only 10% of workforce have finished college?

oaiLGt
No.6316
>>6315
While 4.2 per cent of the workforce, equipped with advanced education and specialised skills, earns between ₹4 lakh and ₹8 lakh annually, about 46 per cent earn less than ₹1 lakh, predominantly comprising low to semi-skilled workers like agricultural labourers, clerical staff, factory workers, and small-scale service providers.
Low educational skills in the workforce make a mismatch between their academic qualifications and job market demands. This mismatch has resulted in over 53 per cent of graduates and 36 per cent of postgraduates being underemployed in roles below their educational qualifications.
This is just rubbish.

xx+WS/
No.6317

oaiLGt
No.6318
>>6317
I'm past age limit for meme exam jobs sirs.

xx+WS/
No.6319
>>6318
appsc/tspsc age limit is 40+ ra

2w003J
No.6322
>>6319
Yes but... I really need a job man. I may become sterile in a few years.
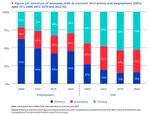
In the roughly two decades between 2000 and 2019, the Indian economy’s production structure moved straight from agriculture to services-led growth without substantial expansion in the share of manufacturing. The manufacturing sector underperformed compared to the overall gross value added (GVA) growth (figure 2.6). As a result, the share of manufacturing in GVA stagnated, at around 15–18 per cent, which was much lower than in developed economies and even much lower than in East and South-East Asian countries.

KtepqF
No.6324
>>6304(OP)
There are startups target those.

2w003J
No.6325
>>6324
Yes, I plan to cold email these buggers from tomorrow.
Although there
has been a rise in the share of formal sector employment, there also has been an increase in the share of informal workers within the formal sector, which is also referred to as the “informalization” of the formal sector. This trend was accentuated between 2019 and 2022, as reflected in the decline in the proportion of regular formal workers or better-quality work.
There was growth in (the share of) the formal sector between 2000 and 2019. Around 11 per cent of all workers engaged in the organized sector in 2000. This increased to almost 20 per cent in 2019, but the share declined to 18.9 per cent in 2022. The share of formal employment in the economy also increased, although to much less extent. This indicates that a large part of the increasing number of workers in the organized sector were informal workers. The share of formal employment in total employment increased, from 8.5 per cent in 2000 to 10.5 per cent in 2019 but declined to 9.7 per cent in 2022 because a large share of the additional workforce was part of the informal economy.

2w003J
No.6326
>>6325
Only 10% work in formal sector, just fucking 10. Only 20% are working in organized sector. 4 in 5 jobs don't cover labor rights. This is just total shit.

2w003J
No.6327
>>6325
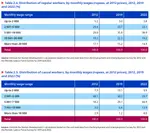
Over the past decade, the average monthly real earnings of regular salaried and self-employed persons either declined or remained stable. The average real earnings of casual workers only slightly increased, pointing to poor-quality employment generation.
Only 15% of regular workers earned more than 20k per month. Only 8% of casual workers earned more than 10k per month.

2w003J
No.6328
>>6327
https://clc.gov.in/clc/min-wages
The Ministry of Labour and Employment regularly updates the daily minimum wage it prescribed for workers engaged in various scheduled jobs across the country.
At the all-India level, 40.8 per cent of regular workers and 51.9 per cent of casual workers did not receive the average daily minimum wage prescribed for unskilled workers in the agriculture sector.

2w003J
No.6329
>>6328
Only around 8% of total existing jobs involve medium or high skill human output.
The rest?
Mindless drones and AI can do it.
Medium skill (III): Typically involves performance of complex technical and practical tasks that require an
extensive body of factual, technical and procedural knowledge in a specialized field (NCO code 3 for
professional and technical associates).
High skill (IV): Typically involves the performance of tasks that require complex problem-solving, decision-
making and creativity based on an extensive body of theoretical and factual knowledge in a specialized field (NCO code 2).

2w003J
No.6335
The manufacturing sector consistently experienced an increase in the share of high- and medium-skill (2.9–6.7 per cent) and no-skill jobs (9.7–20.4 per cent) between 2000 and 2022 (figure 2.16). However, this trend did not apply to all enterprises. In the Indian manufacturing sector, more than 90 per cent of enterprises are micro and small and informal, relying heavily on manual and unskilled labour for their operations, as documented by Mehta, Laha and Sharma (2022), Goldar (2014) and Mazumdar and Sarkar (2013). This trend was more prevalent in the formal, capital-intensive and modern manufacturing sectors, such as automobiles, electronics and pharmaceutical units.

2w003J
No.6336
>>6335
In the services sector, the share of high- and medium-skill jobs in public administration, health and education (45.1 per cent) and financial, business and real estate (42.3 per cent) is much higher than in transport, storage and communication (19.7 per cent) and trade, hotels and restaurants (3 per cent) (table 2.14). On the contrary, the share of low- and no-skill jobs are predominant in trade, hotels and restaurants (97 per cent). In particular, the share of high- and medium-skill jobs consistently increased among the transport, storage and communication category between 2000 and 2022 (from 2.7 per cent to 19.7 per cent), which includes information and communication technology-related services. The demand for high-and medium-skilled ICT workers accelerated during and after the COVID-19 pandemic.
Technological changes have increased the employment of highly skilled labour and reduced employment of low-skilled labour (often in absolute terms) in the manufacturing and services sectors over the past two decades (Ghose and Mehta 2022). Unlike in developed economies, however, the technological change has not reduced the employment of medium-skilled labour in absolute terms. In addition, technological advancement in India has led to **demand for high- or medium-skilled workers in select sectors, such as large and medium-sized manufacturing enterprises and modern services, like information and, communication and software services, but at a much lower level than in developed economies. The robotization rate in India is still very low, accounting for only 0.8 per cent of the global robots, with 4,945 industrial robots in 2021, and is largely confined to capital-intensive industries and medium-sized and
large services units, where it is used in few tasks with a low chance of displacing low-skilled and unskilled labour to a large extent in the near future (Ghose 2023; Mani 2022; Mehta et al. 2022).**

2w003J
No.6337
>>6336
Union Minister Nitin Gadkari on Tuesday said the food delivery economy is very important for India as it generates large-scale employment. Addressing Zomato's 'Sustainability and Inclusivity: Role of the Platform Economy' conference, the Road Transport and Highways minister said that at present India has 77 lakh delivery workers and this number is likely to touch 2.5 crore by 2030.
There are several estimates of the number of gig workers in India. In 2021, the Boston Consulting Group (2021) estimated gig economy jobs in India at between 8 million and 18 million, with a projection of more than 90 million in the next eight to ten years. According to a National Institution for Transforming India (NITI Aayog) study, there were 7.7 million gig workers in 2021, constituting 2.6 per cent of the total non-farm workers, or 1.5 per cent of the total workforce in India.

METkkR
No.6338
>>6337
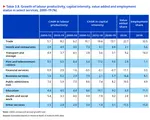
Ideally, a robust economy aims to increase employment alongside steady or rising productivity within a given sector. In particular, the agriculture and construction sectors exhibited the lowest levels of productivity over the past two decades, whereas manufacturing and services recorded substantially higher productivity levels. The growth rates of the manufacturing and services sector experienced a substantial upswing between 2000 and 2019. Conversely, the productivity of the construction sector not only remained low but had much lower growth. Intriguingly, both the agriculture and construction sectors recorded negative growth rates in productivity between 2019 and 2022. This signifies that the growth in employment, particularly in the long term within the construction sector and more recently in agriculture, primarily consisted of low-productivity and low-paying jobs.

METkkR
No.6339
>>6337

METkkR
No.6340
Construction
Construction is the only sector in the economy that showed high employment elasticities throughout the post-reform period, with output and employment growth mostly moving together, as discussed in section 3.4. This sector is a catch-all sector that acts as a pool of surplus labour during crisis conditions and amplifies employment growth during boom conditions by raising demand for infrastructure-related growth. It is important to underline here that employment in this sector remains overwhelmingly casual and informal in nature, with almost a negligible share of regular or formal employment. The low wages, no job security and complete absence of any social protection networks in these sectors with such casual employment are also well documented (Srivastava 2020; Tiwary et al. 2012). Wages and productivity remain only higher than agriculture and, hence, for workers without job-related skills it remains an important source of employment and a route to (partial) structural transformation in India in the coming years.
Manufacturing
Formal employment and the formal and organized sector employment, however, continued to be less in total manufacturing employment. According to the Reserve Bank of India-KLEMS data, the share of organized manufacturing sector GVA constituted more than half of total manufacturing GVA in 2019, though its share in total manufacturing employment was just about one third of total manufacturing employment.
Organized sector firms include all those firms covered in the Annual Survey of Industries data. It covers all factories registered under sections 2m(i) and 2m(ii) of the Factories Act, 1948 – those factories that use electricity and employ ten or more workers; and those not using electricity and employing 20 or more workers.
What this means is... there are 2/3rd of companies out there that is producing economic activity but doesn't even employ 10 workers in it, or 20 workers if they don't use electricity.

METkkR
No.6341
>>6340
The Annual Survey of Industries data showed that organized factory sector employment grew at about 3.7 per cent annually from 2008 to 2019, which also contributed to the expansion of the organized sector employment share in total employment. A large part of this growth, however, was in contractual employment (nearly 5.6 per cent). Some recent studies also found that the rise in organized sector employment may be attributable to a shift in employment from the unorganized manufacturing segment to in-house production within organized manufacturing through greater use of contractual employment, given the substantive growth in contractual employment within the organized sector (Goldar 2023; Mehrotra 2021). Goldar also attributed a part (about 10 per cent) of this growth in organized employment to the formalization of informal manufacturing enterprises.

METkkR
No.6342
>>6341
Services
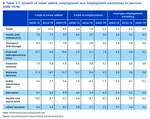
The spectacular performance of services exports, especially in IT and IT-enabled services, is often remarked upon in this context. It also generated much debate in the literature on the sustainability of the process and its implications for employment. Services GVA rose steadily, with an annual average growth rate of 7–8 per cent and an employment elasticity of about 0.3–0.4, which was the highest after construction in the economy. Where the quality of employment is concerned, the regular (52 per cent in 2019) and formal employment (35 per cent in 2019) always constituted a significant proportion of services employment. However, similar to the manufacturing sector, the informal employment and organized and informal sector employment constituted about 77 per cent and 65 per cent, respectively, of total services employment by 2019.
The disaggregated subsector analysis using Employment and Unemployment Survey data, Periodic Labour Force Survey data and the Reserve Bank of India-KLEMS data found that trade, hotels and restaurants, transport, storage and other services consisted of a relatively large proportion of informal employment and a large share of the unorganized and informal sector in their total employment (more than 80 per cent in 2019). The business and financial services and a large portion of the information and communication services, also referred to as modern services, that emerged in the Indian economy and were spurred by growth in IT-enabled services, had a large share of formal employment in their total employment (more than 60 per cent in 2019). Public administration, defence, compulsory social security, education, health and social work constituted the social sector. In almost all the new services and social sectors, the share of regular formal sector employment was more than 80 per cent and 70 per cent, respectively, in 2019.
If you want a proper organized regular salaried job, this is where it's possible. No wonder everyone are going after government jobs and IT jobs. You have at leas 60% chance to get a job that is covered by labor laws.
>financial services
>business services
>other services
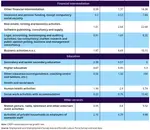
These three has an employment elasticity of >0.6. More chances of getting a job in these three than anything else. Public Administration shows -0.2 which means... they have chipped off jobs since 2000.
Trade, transportation and Education seems to be the major service sectors, followed by Business Services and Hotels. Public Administration comes at approx. 5%. Quite low.

METkkR
No.6343
The significant employment growth in the construction sector during 2019–22 can be attributed to construction of buildings, construction of roads and railways, construction of utility projects and building completion and finishing (see appendix table A3.5b). However, the bulk of employment generated in construction is of poor quality – casual and irregular types. It is also evident by the low earnings or wages in casual work.
Nope. Not for me.

METkkR
No.6346
>>6343
The manufacturing
subsectors, which generated additional employment in 2019–22, include the manufacture of wearing apparel; the manufacturing of jewellery, bijouterie and related articles; and the repair of fabricated metal products, machinery and equipment. These subsectors generated largely regular and self-employment types of employment, which are generally of better quality than construction sector jobs.
Wearing apparel?
Jewellery?
I can't get into those shit.
Employment in some manufacturing subsectors, however, declined substantially: spinning, weaving and finishing of textiles; manufacture of grain mill products, starches, starch products and prepared animal feed; manufacture of wood, cork and straw products and plaiting materials; and the repair of personal and household goods (footwear, electrical appliances, TVs and VCRs, radios, watches and bicycles). This indicates that the employment-generating capacity of traditional manufacturing subsectors that largely relied on manual labour may have declined over the years, possibly due to the technological changes or a reduction in demand for such goods.
The six important employment-generating subsectors in organized factory employment at the three-digit level between 2009 and 2019 were (highest to lowest): the manufacture of parts and accessories of motor vehicles; the manufacturing of plastic products; the manufacturing of knitted and crocheted apparel; and the manufacturing of pharmaceuticals and medicinal chemical and botanical products. They not only recorded a high growth rate each but also generated substantial additional employment. The processing and preserving of fish, crustaceans and molluscs and the manufacturing of refined petroleum products also recorded high growth, but with a smaller number of additional employment generated and a smaller share in total organized manufacturing employment. These important sectors constituted nearly 17 per cent of the total employment share and 29 per cent of the total additional employment generated in the decade between 2009 and 2019.

METkkR
No.6347
>>6346
Most of the employment growth in the tertiary sectors occurred in business, finance, real estate, health, education, communications and hotels and restaurants between 2000 and 2019, which also had relatively higher employment elasticities. However, there were some changes in employment across the different services subsectors afterward, between 2019 and 2022. Specifically, employment in trade, hotels and restaurants as well as in transport, storage and communications services increased, while employment in financial, real estate and business services as well as in public administration, education, health and other services declined.
The most important subsectors in terms of additional employment generation from 2019 to 2022 were: maintenance and repair of motor vehicles; other land transport; other specialized wholesale and retail sale of food, beverages and tobacco in specialized stores; retail sale of other household equipment in specialized stores; retail sale of other goods in specialized stores; restaurants and mobile food services activities; beverage-serving activities; computer programming; consultancy and related activities; and monetary intermediation.
These services subsectors largely generated regular and self-employment types of employment and mostly in the urban areas. Regular employment was predominant in software publishing, consultancy and supply and business activities and other financial intermediation, while self-employment was more common in restaurants, bars and canteens and educational activities.

METkkR
No.6348
>>6347

METkkR
No.6349
>>6348
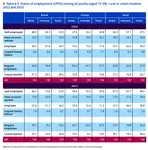
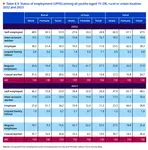
I am aiming for regular formal jobs and as per this data, it's 9.5% in 2022.
Approx. 55% are self-employed.

METkkR
No.6350
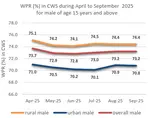
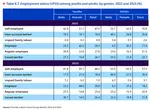
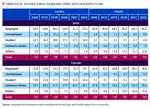
Young women mainly engaged in domestic duties, whereas male youths were more involved in economic activities and also pursuing education. In 2022, about 45.1 per cent of female youths engaged in domestic duties, whereas only 0.5 per cent of male youths were involved in domestic duties. In numbers, 79.1 million young women engaged in domestic duties, compared with only 1 million men. This phenomenon was more typical among youths living in rural areas than those in urban areas. And 53.5 per cent of young men were involved in economic activities, compared with only 19.1 per cent of young women.

METkkR
No.6351
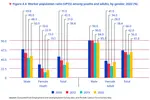
According to this graph, 85% of men and 40% of women are working... (2022 data).

METkkR
No.6355
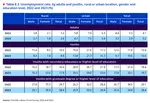
The youth unemployment rate increased with the level of education, with the highest among graduates and higher among women than men. The educated unemployment rate increased over the past 22 years, but with a sharp decline between 2019 and 2022. In 2022, the unemployment rate among youths was six times greater for those who had completed secondary education or higher (18.4 per cent) and nine times higher for graduates 27 (29.1 per cent) than for persons who could not read or write (3.4 per cent). This was relatively higher among educated young women (21.4 per cent) than men (17.5 per cent), especially among female graduates (34.5 per cent), compared to men (26.4 per cent) with similar qualifications.
Unemployment in India was predominantly a problem among youths, especially youths with a secondary level of education or higher, and it intensified over time. In 2022, the share of unemployed youths in the total unemployed population was 82.9 per cent (figure 4.10). The share of educated youths among all unemployed people also increased, from 54.2 per cent in 2000 to 65.7 per cent in 2022. Among the educated (secondary level or higher) unemployed youths, women accounted for a larger share (76.7 per cent) than men (62.2 per cent). This indicates that the problem of unemployment in India has become increasingly concentrated among the youth, especially educated youths and women in urban areas.
The more you study, the more you're going to end up jobless. How much? 66% Of course, educated unemployed young men are only 38% employed. The rest? Meme exam preparation probably.

METkkR
No.6356
>>6355
One in three young people was not in employment, education or training in India, which was almost equal in rural and urban areas and increased over the years. In 2022, the proportion of youths with such status remained high, at 28.5 per cent, with almost equal proportions in rural (28.7 per cent) and urban areas (29.7 per cent). This proportion of youths increased from 29.9 per cent in 2000 to 33.4 per cent in 2019 but decreased to 28.5 per cent in 2022. This indicates that many young people missed out on a crucial early stage of their personal development and risk facing severe disadvantages in the labour market in the future (ILO 2022a).

METkkR
No.6357
>>6356
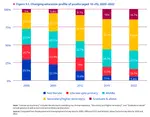
The proportion of young people with a secondary or higher levels of education more than doubled in the past two decades, from 27.9 per cent in 2000 to 58.3 per cent in 2022 (figure 5.1). The percentage of young individuals with a graduate-level of education or higher also experienced great growth, rising from 5 per cent to 14.7 per cent between 2000 and 2022. But the share of youths who are not literate plummeted, from 29.5 per cent in 2000 to 5.4 per cent in 2022, and those with only a primary level of education also declined, from 20.7 per cent to 10.7 per cent. Although this progress is remarkable, at least in quantitative terms, still, 41.8 per cent of young individuals in 2022 had only completed elementary education or had no formal education at all.

METkkR
No.6358
>>6357
Only 15% of total youth population have actually finished college.

METkkR
No.6359
Technical education comprises degree, diploma and certificate courses in agriculture, engineering, technology, medicine, crafts and other professional and technical subjects. Because these subjects centre on specific practice-oriented knowledge in fields directly related to technical and professional areas that are in demand due to the structural transformation, they are expected to create greater employability among youths.
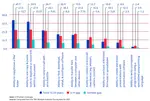
Despite the increase in the proportion of youths with technical education over time, the level of technical qualification among young people remains relatively low in India. In 2005, 33 2.8 per cent of youths had earned a technical degree, diploma or certificate (0.3 per cent for a degree, 1.7 per cent for a graduate-level (below or above) diploma and 0.8 per cent for a certificate). By 2022, that proportion of youths with a technical qualification had nearly doubled, to 4.6 per cent (1.9 per cent with a technical degree, 0.8 per cent with a diploma and 1.9 per cent with a certificate) (figure 5.8).
Only 5%... just 5% have a technical degree. Of which 2% is just diploma level. Only 3% have finished bachelors in a technical degree. This is really sad.

METkkR
No.6360
>>6359
Only 5% of total young men had a graduate technical degree. Meanwhile, only 3% of young women had a graduate technical degree. In 2022 btw.

METkkR
No.6361
This is quite sad.
As of 2021, the Indian youth population could be described as possessing low ICT skills. Just around two fifths could copy and move a file or folder or use the copy-and-paste tool to duplicate or move information within a document. Nearly three fourths of the youths were unable to send an email with attached file, whereas more than 90 per cent of youths could not use arithmetic formulae in spreadsheets, make PowerPoint presentations with presentation software or write a computer program using specialized programming language.
The rural–urban disadvantage far outstripped the disadvantage for women in relation to men in terms of ICT skills. For instance, 61 per cent of urban youths had capability of copying or moving a file and folder while only 34 per cent of rural youths had similar skill. And one fourth of urban youths could connect and install new devices (camera, modem, printer, etc.), while only 8 per cent of rural youths could do so.


cf2ekY
No.6370

2w003J
No.6379
The relationship between levels of education and the worker population ratio among non-student male youths and all youths exhibits an inverted U-shaped curve, indicating that youths with low and high levels of education tend to participate less in the labour market. This finding is consistent with previous studies (UNESO 2019; World Bank 2018). In 2022, the worker population ratio for youths with an elementary or a secondary or higher-secondary level of education was 59 per cent and 57.8 per cent, respectively, indicating relatively greater participation rates (figure 5.12). Youths with less than a primary education and youths with a graduate degree had a lower worker population ratio, at 54.3 per cent and 52 per cent, respectively (figure 5.11. Interestingly, when analysing the worker population ratio by education level among young women, a slightly U-shaped curve emerged, reflecting a different pattern than that of the men and aligning with the findings from several previous studies (see for example, ILO 2020a).
Basically, if you are a man and you have a graduate degree, the chances of you being in workforce is the same as that of being a man and having cleared only upto primary school. Br00tal huh?
This goes against society that says shit like Education is power.

2w003J
No.6380
>>6379
The share of technically qualified individuals among non-student youths expanded over time, although it remained relatively low. However, the worker population ratio among youths with technical degrees experienced a more substantial decline than youths with a technical training diploma. In 2022, the worker population ratio among youths with a technical degree (62.3 per cent) or a below-graduate-level diploma (66.5 per cent) was relatively higher than youths without any technical qualification (56.3 per cent) or graduates with a diploma (60.6 per cent) (figure 5.13). However, the worker population ratio among youths with a technical degree and those without any technical qualification declined more sharply than among diploma holders between 2005 and 2022 (ILO 2022a). These findings suggest two important factors: First, there has been an increase in the supply of youths with technical degrees, indicating expansion in technical education (ILO 2022a). However, the declining worker population ratio among technical degree holders suggests challenges, such as a lack of suitable job opportunities or a mismatch between their skills and the demands of the labour market (ILO 2022).
Check this out. In 2005, 76% with a tech degree were employed, and in 2022, it reduced to 62%. That's 14% drop. Something that's obvious right now but nice to see it in terms of numbers.

2w003J
No.6381
>>6380
The unemployment rate increased among youths with a high level of education and was highest among youths with a graduate degree or higher in 2022. In 2022, the unemployment rate among youths with a graduate degree was significantly higher, at 28.7 per cent, than among youths with less than a primary education, at 3.2 per cent – almost nine times greater (figure 5.14). The share and number of unemployed graduate degree holders increased substantially between 2000 and 2022, while the share of unemployed youths with a low level of education declined. This indicates a problem of unemployment for highly educated youths, who accounted for nearly half of the total unemployed non-student youths in 2022.
Why would anyone even value education in a country like this?

2w003J
No.6382
>>6381
The unemployment rate among youths with a technical training degree or a graduate diploma was even higher than among general graduates and had increased over time. In 2022, the unemployment rate among youths with a graduate diploma was the highest, at 31.1 per cent, closely followed by those with technical training degree, at 29.4 per cent. This indicates the challenges faced by youths with technical qualifications in finding suitable employment opportunities.
The unemployment rate among technical degree holders increased more sharply than it did for graduate diploma holders and among youths with less than a graduate diploma over time. This suggests a growing issue of unemployment among youths with higher technical qualifications.
Why do engineering colleges even continue to exist?
You have 30% of chances to become jobless studying this shit. Meanwhile a non-tech degree gets you only 10%. Yeah, higher pay. Fine.

2w003J
No.6383
The unemployment rate among highly educated youths from a marginalized Scheduled (indian) or Scheduled Tribe group was higher when compared with similar youths from Other Backward Class or General Category. Among youths who had completed secondary or higher-secondary education in 2022, the unemployment rate for those from a Scheduled (indian) (13.4 per cent) was higher than for those from an Other Backward Class (10.5 per cent) and almost equal to those from a General Category (indian) (14 per cent) (figure 5.17). Among youths with a graduate degree or higher, the unemployment rate for those from a Scheduled (indian) (35 per cent) or Scheduled Tribe (33.4 per cent) was higher when compared with youths from an Other Backward Class (28.7 per cent) or a General Category (indian) (26.5 per cent).

2w003J
No.6384
>>6383
In 2022, 63.5 per cent of youths with a graduate or higher education were engaged in the tertiary sector. This reflects the preference for white-collar jobs and the demand for skilled professionals in services-based industries. In contrast, the involvement of highly educated youths in primary and secondary sectors was relatively low, with 12.2 per cent of youths having less than a primary education and 32.7 per cent at the secondary level (figure 5.22)
I would actually like to work under the sun or in the shop floor.

2w003J
No.6385
Almost half of the youth respondents reported searching job through internet or other online applications(47.8%) followed by newspaper advertisement/applications (17.8%), word of mouth/personal contacts (14%), with few from social networking sites, registration with employment exchange, and on-line placement agencies (Table 4.14) The method of internet search or use of online applications was more popular among females compared to males, which across cities these search methods were more prevalent among youth in Delhi than in Ranchi. Newspaper advertisements and word of mouth or personal contacts was also more popular search method in Delhi’s youth compared to Ranchi, which is obvious due to higher penetration of these job search modes in the former than latter.

2w003J
No.6386
>>6385
More than half (55.3%) of the respondents revealed that they were looking for the job through internet searches/online applications (55.3%), followed by newspaper advertisement (13.2%), word of mouth/personal contracts (31.6%). In particular, female were looking for the jobs through newspaper advertisements more, while males from internet search/online applications and word of mouth/personal contacts. The constraints faced in getting better jobs were non-availability of jobs matching with education/skill/experience (38.5%) followed by unavailability of jobs in local areas(25.6%), with equally lack of communication skill (5.1%), lack of regular jobs (5.1%), lack of information of new jobs(5.1 %) and non-availability of adequate remuneration(5.1 %).

7e8QAm
No.6391
Only 36 per cent of companies conduct in-house enterprise-based training programmes. Thus, skills training in India is still largely government driven, with inadequate industry participation. In comparison, as much as 86 per cent of companies in Germany, 85 per cent in China, 52 per cent in the Russian Federation and 51 per cent in Brazil and Mexico train their workers themselves (NSDC 2020)


cf2ekY
No.6392
>>6391
bump, kal read kareella

2w003J
No.6393
Sectors such as IT/BPO imparted skill training in 29.8 percent of estimated establishments, followed by 22.6 percent
financial services and 21.1 percent education sector’s establishments. Further, about 24.3 percent estimated establishments were found to be imparting ‘On-the-Job’ training, which is higher in IT/BPO sector (36.1 percent of establishments) and financial services sector (34.8 percent).

2w003J
No.6394

2w003J
No.6395

RMLxyZ
No.6396

RMLxyZ
No.6397
>>6396

RMLxyZ
No.6398
>>6397

831o3e
No.6399
Shouldn't you be posting this in >>>/acd/? Are you rakulcel?

RMLxyZ
No.6400
>>6398

RMLxyZ
No.6401
>>6400

RMLxyZ
No.6402

RMLxyZ
No.6403
I digged up enough data. This is a very good report. I'm honestly impressed that there are actual data about unemployment out there unlike the common whining that I see online in subreddits or in imageboards about how India is hiding data from the population and so on.
https://www.ilo.org/sites/default/files/2024-08/India%20Employment%20-%20web_8%20April.pdf
Now I have to sit down and try to collect only the data that I give a fuck about, my personal situation and observe the pattern.

Z9Z4LQ
No.6404

831o3e
No.6405
>>6404
Difference is that Kerala is well off and people rather prefer being unemployment than do some low paying jobs.
Uttarakhand doesn't have much opportunities to begin with, most of it comes from army recruitment, government jobs and tourism.
Bihar is just poor and doesn't have lot of employment opportunities but they are so poor that they will take any job available.

831o3e
No.6406
>>6402
Not going through your entire thread so what is the summary or solution if you have any?

RMLxyZ
No.6410
Yatta!
ChatGPT is telling me I have 45 to 50% chance of getting a job in next 6-12 months. At this point it's no different from Astrology and Horoscope.
>>6404
Yes, check out this >>6379
Unemployment is a U shaped curve. You have the same chances if you have a graduate degree to that of not even even finishing primary school.


